
ARM vs. Marvell Technology: What Revenue Trends for These Artificial Intelligence Companies Tell Investors
ARM vs. Marvell Technology: What Revenue Trends for These Artificial Intelligence Companies Tell Investors
ARM: An Uneven but Upward Revenue Trajectory
ARM (NASDAQ:ARM) primarily generates its operating revenue by conceptualizing, engineering, and licensing core computing processing unit designs, graphics processing units, and complementary system intellectual property solutions for various semiconductor manufacturers and original equipment manufacturers operating across multiple global industries.
It collaborated with several partner organizations to develop a capability framework tailored specifically for autonomous systems, and it recently hosted a developer event in California to actively support newly emerging computing architectures across the broader technology landscape.
Marvell Technology: Consistent Quarter-Over-Quarter Revenue Growth
Marvell Technology (NASDAQ:MRVL) primarily generates its revenue by designing and providing data infrastructure semiconductor solutions, integrated analog circuits, storage controllers, and specialized ethernet processors that span from the centralized data center core directly out to the broader network edge.
It officially announced plans to expand its technical engineering workforce and physical facility operations located in India over the next three years, while it also expanded a multi-year manufacturing agreement to increase its overall optical connectivity production capacity.
Why Revenue Matters for Investors
Revenue measures a company's ability to generate baseline sales before accounting for expenses. This metric reveals whether an organization is successfully attracting customers and growing its overall business volume over time.
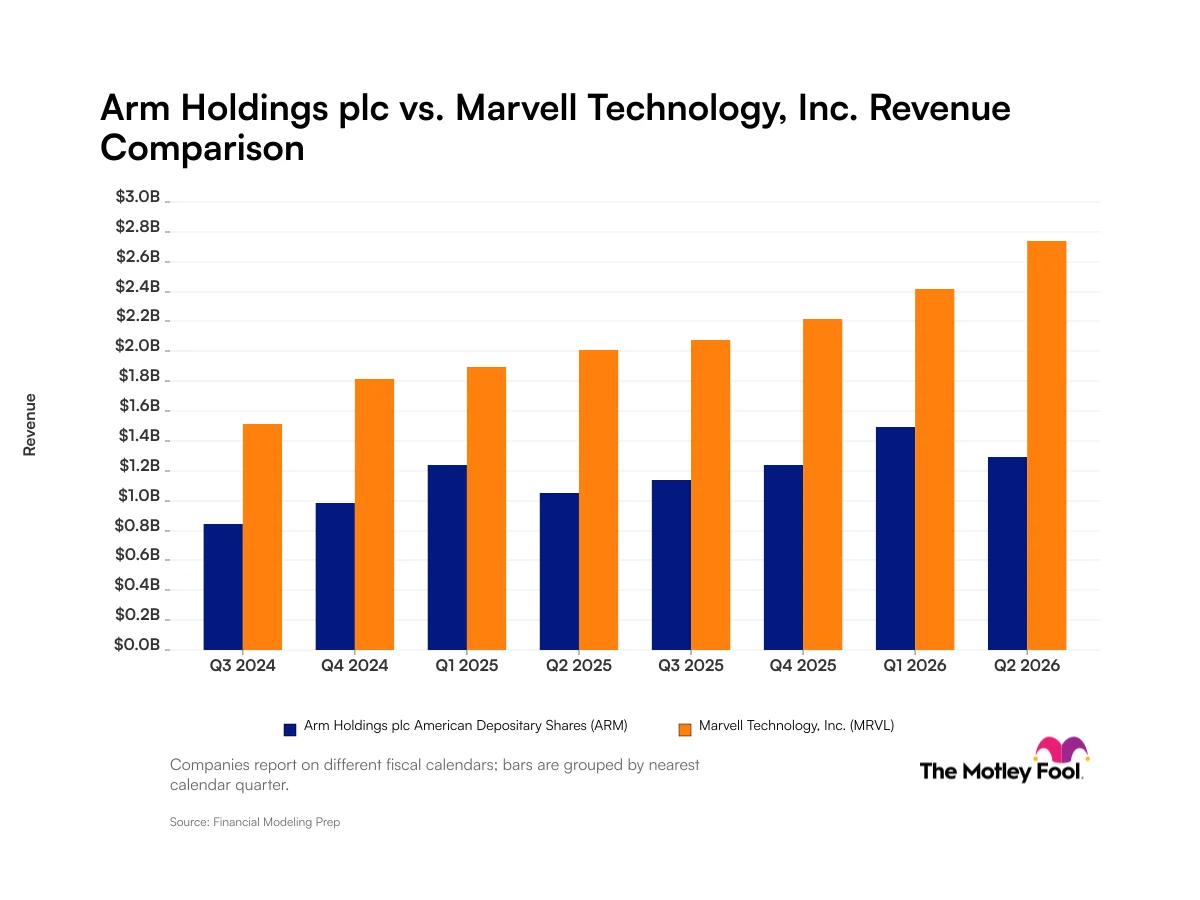
Quarterly Revenue for ARM and Marvell Technology
$844.0 million (quarter ended Sept. 30, 2024)
$1.5 billion (quarter ended Nov. 2, 2024)
$983.0 million (quarter ended Dec. 31, 2024)
$1.8 billion (quarter ended Jan. 31, 2025)
$1.2 billion (quarter ended March 31, 2025)
$1.9 billion (quarter ended May 3, 2025)
$1.1 billion (quarter ended June 30, 2025)
$2.0 billion (quarter ended Aug. 2, 2025)
$1.1 billion (quarter ended Sept. 30, 2025)
$2.1 billion (quarter ended Nov. 1, 2025)
$1.2 billion (quarter ended Dec. 31, 2025)
$2.2 billion (quarter ended Jan. 31, 2026)
$1.5 billion (quarter ended March 31, 2026)
$2.4 billion (quarter ended May 2, 2026)
$1.3 billion (quarter ended June 30, 2026)
$2.7 billion (quarter ended Aug. 1, 2026)
Data source: Financial Modeling Prep. Data as of Sept. 25, 2026.
Related Stories
 Technology
How uOttawa’s Faculty of Science is accelerating innovation and entrepreneurship
8 minutes ago
 Technology
Trio-Tech secures $4.45M three
8 minutes ago
 Technology
LYB and exoIQ collaborate on material solutions for industrial wearable exoskeletons
8 minutes ago
 Technology
Impact of technology in offshore sailing
8 minutes ago
 Technology
Can Sysco's Technology Push Drive Greater Efficiency and Savings?
2 hours ago
 Technology
EVER Monaco 2026 Puts Sustainable Mobility, AI, and Startups in the Spotlight
3 hours ago
 Technology
Camera Technology Market To 2035: AI-Enabled Vision Systems Drive Growth
3 hours ago
 Technology
Bloom raises $3.6M to become the ‘Alibaba’ of American manufacturing
4 hours ago