
Golden Software Releases Newest Version of Surfer Mapping Program

Golden Software Releases Newest Version of Surfer Mapping Program
Golden Software has focused on enhanced usability in the latest version of its Surfer mapping and 3D visualization software package. New and long-time Surfer users will find it is faster and easier to make high-quality subsurface maps that accurately visualize their 3D data sets.
Surfer is a mapping and 3D subsurface visualization package now used by 100,000 professionals worldwide, many involved in environmental consulting, water resources, engineering, mining, oil & gas exploration, and geospatial projects. The software is relied on to transform complex data into superior 2D and 3D visuals with accuracy.
Surfer enables users to model data sets, apply an array of advanced analytics tools, and visually communicate the results in a way that even the non-technical stakeholders can understand.
The following upgrades have been made in the latest release of Surfer available today:
Streamlined Home Ribbon – The redesigned homepage is more intuitive for more efficient map creation. Users can create a new map and then add multiple spatially aligned layers to it with fewer steps. In addition, all the map components are easily accessible for users to add north arrows, legends, color scales and more. Comments - Users can add comments in Surfer plots by pinning notes directly to project locations, visible to others or only themselves. Comments make it easier to collaborate with colleagues by sharing notes and receiving feedback directly inside the project. This is a major benefit to users who regularly update projects and need to leave reminders on how the map was created or should be changed in the future. Create a Legend from a Base Layer without Symbology – A popular request from users, Surfer now generates a complete Legend from base layers that do not have applied symbology. The Legend includes all the current properties in the base layer – points, polylines, and polygons. The user can control which properties are displayed in the legend and their associated names for a clean, professional layout. 3D Grid Filters – To add greater clarity to 3D visualizations and ensure viewers focus on the most important information, Surfer now offers filters to visualizations created from 3D grids to emphasize or hide certain data. The filters refine the visualization to smooth surfaces, fill holes, highlight anomalies, or delete features and noise. 3D Slice Manipulation – Surfer users have been able to make information-rich contour and image slices from their 3D grids in the 3D View, but now they can use the 3D slices in different ways: Save them from the 3D View as an image or grid file and snap their path to a polyline or polygon. Multiple Clipping Planes – To remove extraneous information, users can clip sections from their 3D block diagrams using up to four planes. They can change the orientation of each clipping plane along the X, Y and Z axes, creating custom shapes that showcase the important data from their grid. Improved Viewshed Workflow – A Viewshed Layer can be created without first creating a map. Surfer automatically generates a default Transmitter location, however, the user can easily choose a different location with the new Pick New Transmitter Position tool. Beta Available Now
Golden Software has released a Beta version of Surfer simultaneously with the new version to give customers a chance to try out new features and provide feedback while they are still in development. Users may find the Beta version by clicking File | Online | Try Beta Version from within Surfer.
The new Beta features are available for testing now:
3D Kriging – One of the most requested new features by users is the addition of kriging in 3D visualizations. Users working with four variables can now make very smooth 3D maps with the kriging algorithm to predict variable values at unsampled locations between known points in their 3D datasets. 3D Fence Diagrams – Users can create Fence Diagrams from 3D drillhole data by connecting drillholes with fence panels in the 3D View. Especially useful in visualizing lithologic layers, the Fence Diagrams allows the user to define the contacts they wish to visualize, and choose which drillholes to connect. The fence panels even show pinchouts if they exist in the layers. Record Video for 2D Views – In a recent version of Surfer, the Record Video functionality in the 3D View was one of the most popular new features. Building on this, Surfer users can Record Video of the 2D Viewshowing their maps for sharing as MP4 files. For example, users can create a snapshot of single 2D map layers or record video of their 2D map being rotated and spun, or layers being turned on/off, to show different perspectives or time stamps of the map. North Arrow – With a click on a new button on the command ribbon, users can add a dedicated North Arrow to their map. The Arrow is customizable to the user’s preferred color, size, and shape. Users can also include an angle to account for True North or Magnetic declination. The Arrow automatically and continuously points to the defined north, even if the map is rotated.
Related Stories
 Technology
GS Chairman Huh Eyes Startup Tech to Ease AI Data Center Bottlenecks
1 minute ago
 Technology
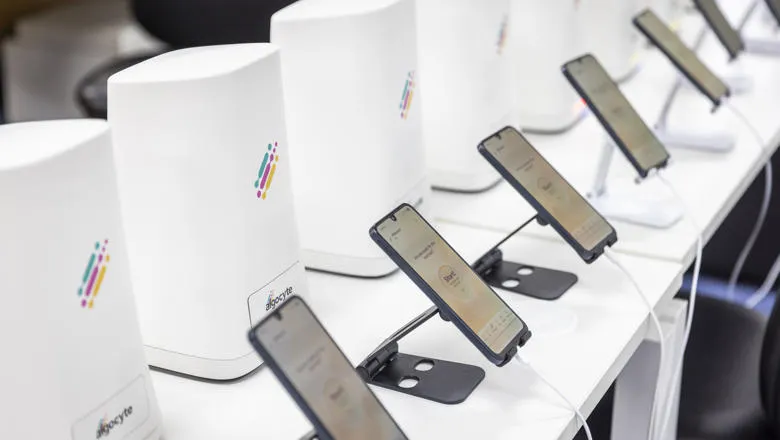
Blood Test Analysis From Home Enabled Through New Tech
1 minute ago
 Technology
What’s New in Microsoft 365
1 minute ago
 Technology
City of Hamilton postpones recreation registration amid 'technical difficulties'
29 minutes ago
 Technology
Adidas To Cut 300
2 hours ago
 Technology
The Importance of Balancing Technology with the Human Experience
2 hours ago
 Technology
Silicon Valley of Europe 2026: Top Tech Hubs & AI Startups
3 hours ago
 Technology
SK Telecom CEO Turns to Startups for New AI Businesses
3 hours ago