
Monitor on-premises and multi

When you deploy AI agents built with frameworks like Strands Agents, LangGraph, and CrewAI, you need observability into their performance. This holds true whether they run on Amazon Elastic Kubernetes Service (Amazon EKS), Amazon Elastic Container Service (Amazon ECS), AWS Lambda, on-premises, or another cloud provider such as Google Cloud Platform (GCP) or Microsoft Azure.
Amazon Bedrock AgentCore is a platform to build, connect, and optimize agents at scale, with any framework or model. Although Amazon Bedrock AgentCore Observability, a capability of Amazon Bedrock AgentCore, provides native tracing, monitoring, and analytics that local cloud monitoring tools don’t offer out of the box, it natively supports only agents deployed on AgentCore runtime in the AWS Cloud. If your agents run anywhere else, you need additional configuration to send telemetry to the dashboard.
In this post, we show you how to set up observability for agents running outside AWS. You learn how to configure the AWS Distro for OpenTelemetry (ADOT) auto-instrumentation in non-AWS environments, route telemetry to the AgentCore Observability dashboard, and validate the setup end to end.
The following diagram shows the end-to-end observability pipeline and how telemetry flows from agents to the AgentCore Observability dashboard.
Figure 1: End-to-end observability pipeline from agents to the AgentCore Observability dashboard
The solution uses the AWS Distro for OpenTelemetry (ADOT) running in-process with the agent application. ADOT auto-instruments the agent framework and captures generative AI semantic convention spans, then exports the telemetry directly to the Amazon CloudWatch OpenTelemetry Protocol (OTLP) endpoint using SigV4 authentication with AWS Identity and Access Management (IAM) credentials.
Sending telemetry from your AI agent to Amazon Bedrock AgentCore Observability requires three core components:
As seen in the following diagram, this cross-platform observability solution integrates several AWS services. Amazon CloudWatch serves as the foundation, handling telemetry ingestion and storage. Amazon Bedrock AgentCore Observability adds specialized monitoring dashboards for AI agents. AWS Distro for OpenTelemetry (ADOT) provides the cross-platform instrumentation capabilities. IAM secures the authentication between your external environments and AWS.
Figure 2: Cross-platform observability architecture and the AWS services involved
Observability is a foundational pillar of responsible AI. By routing telemetry to AgentCore Observability, you gain visibility into agent reasoning chains, tool invocations, and model outputs. This allows you to detect hallucinations, monitor for harmful or off-topic responses, track token usage for cost governance, and audit agent behavior across environments. This is especially critical for agents running outside AWS, where problematic outputs might go unnoticed without centralized observability.
Before you begin, verify that you have:
Turn on CloudWatch Transaction Search
If you haven’t turned on Transaction Search, run the following (one-time per account):
The ADOT auto-instrumentation (aws-opentelemetry-distro) handles the complexity of exporting telemetry from non-AWS environments to CloudWatch:
The following diagram shows how telemetry export through ADOT auto-instrumentation works from non-AWS environments to CloudWatch.
Figure 3: Telemetry export through ADOT auto-instrumentation from non-AWS environments to CloudWatch
Follow these steps to configure and run a Strands agent in a non-AWS environment, with telemetry routed to AgentCore Observability.
On your non-AWS environment (on-premises server, GCP VM, Azure VM, or a compute with internet access):
The aws-opentelemetry-distro package includes the ADOT auto-instrumentation with OTLP exporters specific to AWS and the aws_configurator that handles SigV4 authentication. The strands-agents[otel] package provides OpenTelemetry trace emission from the Strands framework.
Set your IAM user credentials as environment variables.
Security note: For production deployments, consider using IAM Roles Anywhere instead of long-lived access keys. With IAM Roles Anywhere, on-premises workloads can obtain temporary credentials using X.509 certificates.
These environment variables configure the ADOT to route telemetry to the AgentCore Observability dashboard:
Create a file named agent_test.py with a Strands agent:
The opentelemetry-instrument command wraps your Python process with the ADOT, automatically instrumenting Amazon Bedrock calls and Strands framework operations:
The agent’s response appears in the terminal. Behind the scenes, the ADOT captures traces, spans, and logs, and exports them to CloudWatch.
You see telemetry data within two to three minutes of execution. Open the Amazon CloudWatch console:
The following screenshot shows the telemetry from the Strands agent (my-external-agent) running in a non-AWS environment, as seen in the AgentCore Observability dashboard in CloudWatch.
Figure 4: The my-external-agent telemetry in the AgentCore Observability dashboard
The following screenshot shows a successful trace from the Strands agent (my-external-agent) with four spans, model information, and latency and token details in the AgentCore Observability dashboard.
Figure 5: Trace detail for my-external-agent with span, latency, and token metrics
To confirm the solution works from a third-party cloud provider, we tested the same setup from Google Cloud Shell, a browser-based terminal running on GCP infrastructure.
Set up the environment on Google Cloud Shell:
The following screenshot shows the Strands agent (gcp-hosted-agent) running on Google Cloud Shell (GCP) and returning a successful response.
Figure 6: The gcp-hosted-agent running in Google Cloud Shell
Within two to three minutes of execution, the gcp-hosted-agent appears in the AgentCore Observability dashboard alongside agents running on AgentCore runtime or other environments.
The following screenshot shows a successful trace from the Strands agent (gcp-hosted-agent) running on GCP with four spans, model information, and latency and token details in the AgentCore Observability dashboard.
Figure 7: Trace detail for gcp-hosted-agent running on GCP
The telemetry is identical to what an AgentCore runtime-hosted agent produces. Sessions, traces, span metrics, token usage, and latency are all visible in the same dashboard, regardless of where the agent runs.
Although this walkthrough uses Strands Agents, the same ADOT-based pattern applies to other OpenTelemetry-compatible agent frameworks.
When choosing how to deploy your AI agents, understanding the observability trade-offs between different runtime environments helps you make the right architectural decision. Agents deployed directly on Amazon Bedrock AgentCore runtime benefit from automatic observability configuration. Agents running in non-AWS environments require additional manual setup but offer greater deployment flexibility. The following comparison highlights the key differences in telemetry collection, credential management, and use cases to help you determine the best approach for your requirements.
We tested the ADOT auto-instrumentation approach across two non-AWS environments:
Based on our testing, we recommend the following when setting up cross-platform AgentCore Observability:
To remove the resources created during this walkthrough:
This walkthrough uses Amazon Bedrock, Amazon CloudWatch, and AWS X-Ray, which incur costs. See the respective pricing pages for details.
Amazon Bedrock AgentCore Observability isn’t limited to agents running on AgentCore runtime or within AWS. Using ADOT auto-instrumentation with IAM credentials and the correct OpenTelemetry environment variables, you can send telemetry from your choice of environment with internet access. Your agents can run on-premises, on GCP, on Azure, or anywhere else and still report to the same AgentCore Observability dashboard.
The setup requires a pip install and a set of environment variables. The resulting telemetry is identical to what AgentCore runtime-hosted agents produce: sessions, traces, span metrics, and token usage, all in one unified view.
To get started, clone the sample code from GitHub and follow the instructions in the README to configure and run the agent in your environment.
For agents already running on AWS but outside AgentCore runtime (EKS, ECS, Lambda), refer to the AgentCore Observability for EKS-hosted agents tutorial. For agents on AgentCore runtime, observability is configured automatically. See Add observability to your AgentCore resources.
Related Stories
 Technology
Georgia Tech captain Kyle Efford announces medical retirement from football: 'Nothing left in the tank' | OutKick
29 minutes ago
 Technology
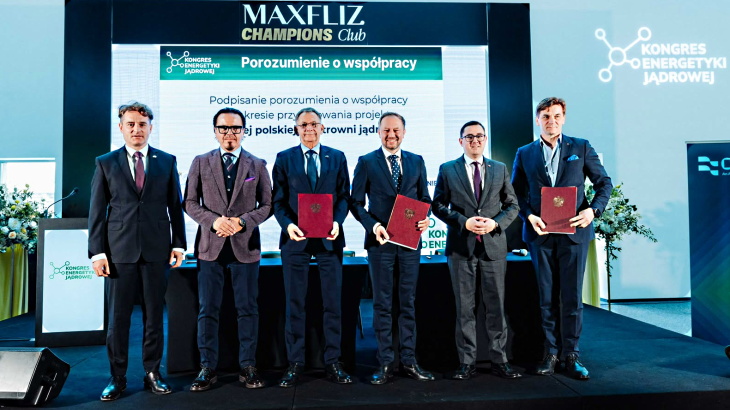
Agreement signed on second Polish nuclear power plant
1 hour ago
 Technology
RPI Team Builds Resource
1 hour ago
 Technology
Cut screen time in classrooms to avoid long
1 hour ago
 Technology
Can Vibe Coded Apps Replace Adobe and Microsoft? These AI Apps Hope So
1 hour ago
 Technology
Two Climate
3 hours ago
 Technology
Westchester Tech Accelerator selectes eight more businesses
3 hours ago
 Technology
Missed Bytes Technology Group? Here’s What Holders Saw
3 hours ago